Evaluate Campaign Results with a Tableau Dashboard
Utah is a state known for it’s natural beauty and famous national parks with an economy that is heavily dependent on tourism. After a drop in visitation following the 9/11 terrorist attack in New York City and the subsequent tightening of travel security, Utah’s parks have experienced annual visitor increases since 2003. Amidst soaring park visitation, the Utah Office of Tourism launched a twelve million dollar ad campaign in 2012 to attract even more visitors to Utah’s “Mighty 5” national parks – Zion, Bryce, Arches, Capitol Reef, and Canyonlands. The campaign was considered a tremendous success and included targeted broadcast television ads, print, outdoor and digital placements, as well as hand-painted murals in Los Angeles and building wraps in Colorado. (See the Mighty 5 television ad on YouTube.)
This report is a summary analysis of the effect of the Mighty 5 campaign on park visitation since the campaign began in March 2013. Park visitor data was obtained from the National Park Service online Visitor Use Statistics report generator Although the government only requires national parks to report monthly aggregate data, this data is sufficiently granular to analyze seasonal and year-over-year trends. Since the Mighty 5 campaign increased attendance at all five national parks, visitor attendance for these parks will be aggregated to illustrate bottom line results although Zion and Bryce disproportionately account for about 60% of these parks’ total visitors.
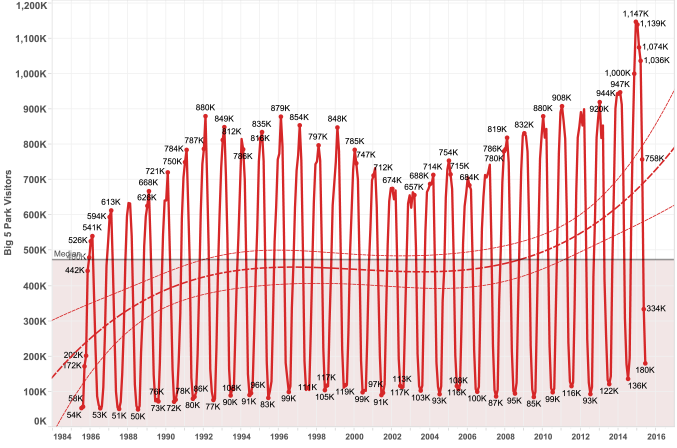
Monthly park data plotted from 1984-2015 illustrates the parks annual visitation trends; peak visitation is from April to October while the winter months realize the least park visitation. The graph also illustrates the parks’ continually increasing visitation since 2003 with a large spike in visitation from 2014-2015 following the Mighty 5 advertising campaign. The purpose of this summary report is to analyze how much of the visitation increase resulted from organic growth compared with how much resulted from the Mighty 5 advertising campaign.

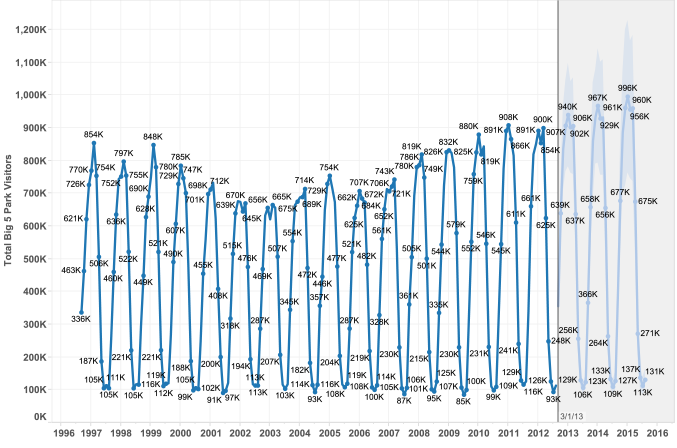
To measure the difference in visitation between organic growth and growth attributed to the Mighty 5 campaign, aggregated park visitor data from 1996 to March 2013 (date of Mighty 5 campaign’s inception) was plotted on a graph and forecast three years through the end of 2015. Tableau utitlizes an exponential smoothing model that iteratively forecasts future values from weighted averages of past values – an effective model when the measure to be forecast exhibits trend or seasonality as is true of park attendance.

As expected with a ten year growth trend, the forecast illustrates additional visitor increases from 2013 to 2015.

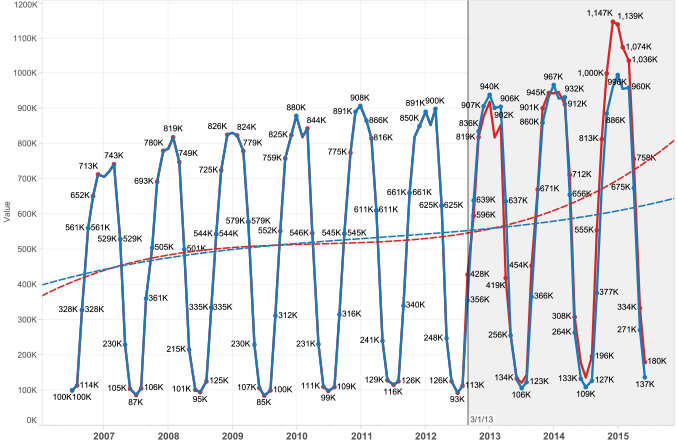
Visitation records confirm there were additional visitor increases from 2013-2015. As the graph above illustrates, the 2013 and 2014 increases can be attributed to organic growth (blue) while the large increase in 2015 can only be attributed to the Mighty 5 campaign (red).

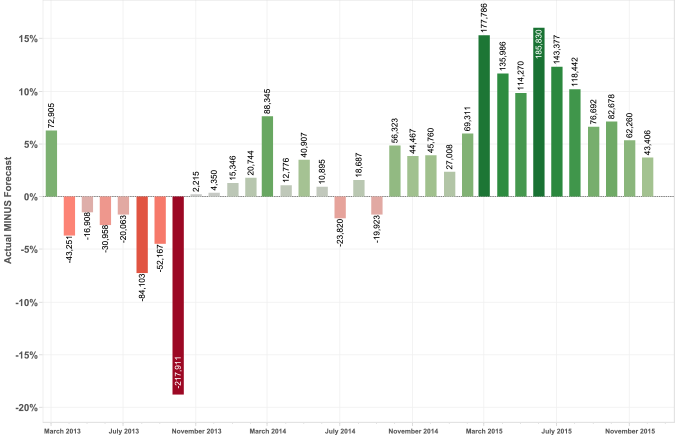
The chart above illustrates the difference between the forecast organic growth and growth due to the Mighty 5 campaign; the campaign is responsible for over 1.7 million additional park visitors from 2013-2015. The Utah Office of Tourism claims that there is $10 of economic impact generated for every dollar invested in promoting tourism. With a cost of $12 million, the Mighty 5 campaign could be expected to generate $120 million of economic impact. With over 1.7 million new visitors, this estimate would equate to $70 of economic impact per new visitor and the total economic impact is likely far greater.
The chart highlights several months with decreases in expected visitation and some of this can be attributed to annual variations in park attendance. Never the less, November 2013 represents an outlier with an actual decrease in visitation of over 200,000 visitors. During research for this project, the Utah Office of Tourism acknowledged this downturn as a result of the US federal government shutdown in October 2013 that closed down the nation’s national parks, including Utah’s Mighty 5. Understanding the economic impact of its national parks, the state of Utah spent over one million dollars to keep the parks open during part of the government shutdown.
In summary, Utah’s Mighty 5 campaign was indeed a tremendous success. Analyzing visitor data and organic growth trends in Tableau illustrates that the Mighty 5 campaign was responsible for raising visitation from 2013-2015 by over 1.7 million visitors, translating into tens of millions in economic impact. Unfortunately most of the attendance growth was generated during the parks’ peak visitor months and at a time where park, health, and community services were already stretched thin. Anecdotal evidence from personal conversations with Springdale hoteliers and restaurateurs (Springdale is at the mouth of Zion National Park) confirm that the campaign was almost “too successful”. Winter months often have 90% or more of inventory, so it would be a good idea for the Utah Office of Tourism to promote the national parks in the down season when many businesses dependent on park visitors reduce staff to a skeleton crew in order to maintain critical employees while incurring operating losses and other businesses simply close down.
Go here to view the online Tableau Workbook for Utah’s Mighty 5 National Parks Attendance Trends